Net Health ® Clinical Trials | Case Study
[bws_pdfprint display=’print’]
SNFs are Leveraging Analytics to Improve Clinical Outcomes:
Artificial Intelligence and Machine Learning are Changing Healthcare
There are three major initiatives that are in the roadmap or at least in the mind of every organization: accelerating digital transformation, becoming data-driven, and scaling of data science capabilities. However, reaching an enterprise next level of analytics maturity becomes increasingly complex with the advent of more sophisticated and complex analytics methodologies, the movement to cloud, transition to open-source technologies, as well as the unprecedented digital market disruption.
According to a 2020 NewVantage Partners survey, 99% of firms are reporting active investment in data science and machine learning. However, fewer than 30% of organizations are experiencing transformational business outcomes because of these investments, and only 24% of them report having created a data-driven organization1. Similarly, research from Boston Consulting Group (BCG) shows that more than 80% of companies are accelerating their digital transformation plans, but only 30% of them are achieving their stated objectives2.
Since 1995, PointRight®, A Net Health Company has been delivering analytics solutions and leading-edge business intelligence to thousands of long-term and post-acute care (LTPAC) providers, hospitals/health systems, and payers.
PointRight® analytics show a 360⁰ view of LTPAC facility performance and clinical outcomes. Equipped with these insights, LTPAC providers and payers improve the accuracy of their reimbursement and regulatory data submissions. Through using analytics, they enhance overall performance in readmissions, quality, and outcomes, including more accurate and compliant resident assessments, reduced rehospitalization rates, optimized care transitions, and improved clinical outcomes, risk management, reimbursement, and operations.
Prediction of Adverse Events Using Machine Learning
Rapidly increasing healthcare costs and concerns about quality of care have resulted in the implementation of value-based purchasing (VBP), the Medicare shared savings program and, bundled payments to further support providers in delivering high-quality, low-cost care and improved resident satisfaction.
For example, hospital readmissions to skilled nursing facility (SNF) within 30 days after discharge are very costly, accounting for more than $17 billion in avoidable Medicare expenditures3. In long-term care, most of these hospitalizations are associated with poor outcomes and occur within two resident populations: post-acute residents within the first 60 days of admission and long-stay residents nearing end-of-life.
Reducing undesired hospitalizations and re-hospitalizations as well as clinical adverse events is a goal for all post-acute care providers. Though the goal is shared, the challenge is unique in each care setting. Careful analysis of each organization’s unique data maximizes the effectiveness of improvement efforts.
Artificial Intelligence (AI) and Machine Learning (ML) algorithms may be used to sift through massive data sets and develop predictive analytics that can assess the likelihood of future risks and outcomes. Better insights into future events help post-acute healthcare providers improve clinical decision-making and business operations, which leads to better resident outcomes, reduced costs, and higher reimbursement.
PointRight’s® research on predictive analytics has resulted in the development of RADAR®. RADAR® is a resident- and population-level care management tool with descriptive and predictive analytics that identify levels of impairment and provide information on the factors that drive medical conditions, such as underlying biological risk factors, socioeconomic factors, and behavioral risks. RADAR®also provides users with a summary score for discharge complexity to prepare residents for safe discharge to the community4.
Descriptive analytics following the definitions of the Centers for Medicare and Medicaid Services (CMS)
- Late-Loss Activities of Daily Living (ADL Index)
- Cognition (Brief Interview for Mental Status (BIMS) for resident interview and Cognitive Performance Scale (CPS) for staff assessment)
- Mood (PHQ-9 for resident interview and PHQ-9 for staff assessment)
- Pain (resident interview and staff assessment)
Proprietary predictive analytics to assess risk for adverse events for short and long-stay populations
- Falls
- Pressure Ulcers
- Hospitalization
- Return to Skilled Nursing Facility (SNF)
- End-of-life (Mortality)
Earlier versions of RADAR® were logistic regression models that were created to address the problem of predicting adverse events for SNF residents and provide simple and straightforward interpretations. These models however were not engineered and productized in a way to continuously track drift and upgrade performance as data and algorithms improve.
The latest RADAR® release, launched on October 19, 2022, is based on improved interdisciplinary processes (see Section 3), cutting edge infrastructure, technology, and data management, as well as state-of-the-art ML models achieving optimal predictive performance (see Sections 4 and 5).
Processes for Data Science Success at PointRight®
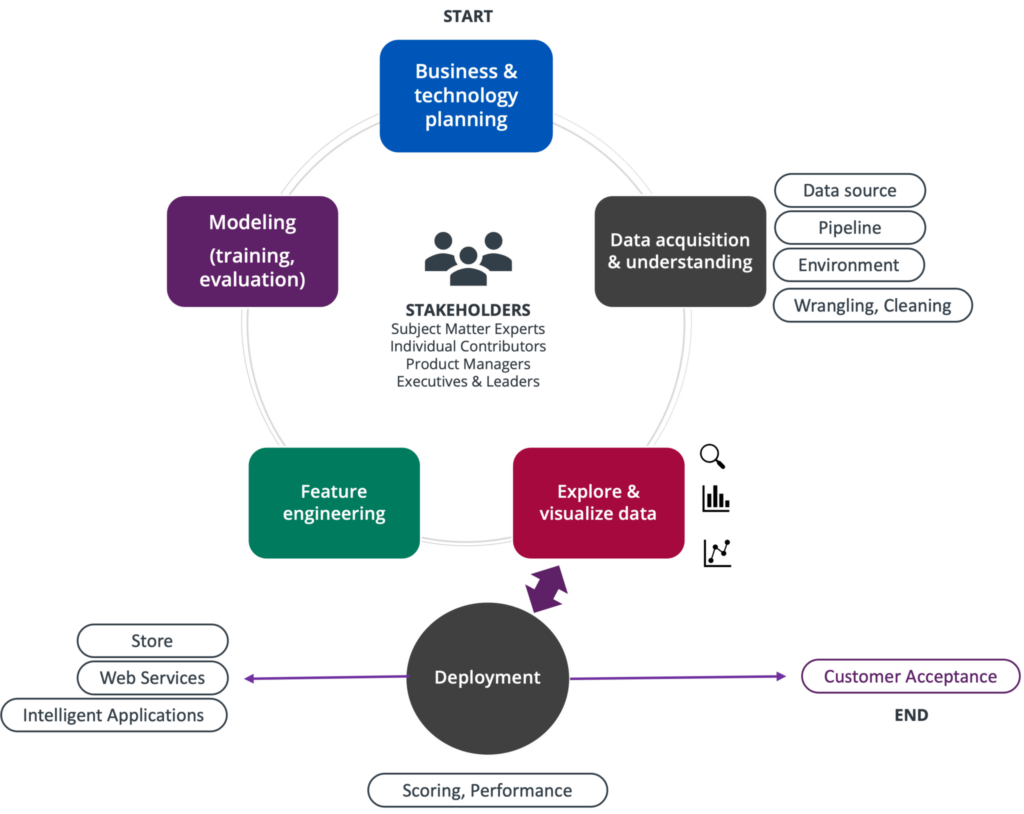
Scaling analytics within an organization requires scaling and standardizing processes to allow teams to speak one common data language and incentivize collaboration. PointRight’s® Healthcare Analytic Development Process (Figure 1) is a rigorous data science process based on the principles of the industry-standard Team Data Science Process by Microsoft (TDSP)5,6. TDSP is an agile, iterative data science methodology to deliver efficiently predictive analytics solutions and intelligent applications. TDSP includes best practices and structures from Microsoft and other industry leaders to help toward successful implementation of data science initiatives.
PointRight’s® TDSP-based process helps individual interactions become more efficient as employees are empowered to move more quickly and is empowering teams to add value throughout multiple opportunities. Quick access to data is the biggest lever here enabling the acceleration of research and development.
Data Preparation at PointRight®
The most powerful tool to identify residents at risk is the use of real-time data. One of the most referenced data sources for SNFs is the Minimum Data Set (MDS). MDS data are collected and made available as one of the many data products of the Centers for Medicare and Medicaid Services (CMS). The MDS is a full clinical and functional assessment of the resident. Like other Medicare data, MDS data are highly complex and require a substantial learning curve to use. PointRight® is the industry leader in ingesting, understanding, and using MDS data with an average daily processing of 35,000 assessments.
To train a model to predict risk at a given time, we need a dataset that contains resident information such as demographic data (e.g., age at time of assessment, ethnicity etc.) as well as time series data about the resident’s medical history. We use the data to train a model that learns the risks that influence the resident’s likelihood of developing an adverse event in the upcoming period.
RADAR® predictive models use MDS data to track a resident’s journey and given their medical history (e.g., diagnoses, comorbidities etc.) and demographic information, we can assess the risk of a resident for a given adverse event within a clinically appropriate period. Some of the data points used in RADAR® predictive analytic algorithms include:
- Resident demographic information, such as their geographic location, race, gender, age
- Individual resident parameters like history of certain cancers or other diseases, types of diabetes, etc.
- Health conditions at the point of care like shortness of breath, pain, fever, etc.
- Hearing, speech, vision ability
- Cognitive patterns, mood, behavior, preferences for customary routine and activities
- Functional status, functional abilities, and goals
- Nutritional status
- Skin conditions and wound characteristics (e.g., eschar granulation in the wound, wound stage, wound size, body location)
- Special treatments, procedures, and programs
Controlling for Data Quality
Data are the food of all analytics projects. According to Andrew Ng bigger improvements in overall AI/ML model performance and accuracy can be achieved by quality and completeness improvements in the data that feed the AI/ML algorithms7.
PointRight’s® Data Integrity Audit (DIA) tool performs MDS verification prior to CMS submission by analyzing the accuracy of each MDS assessment4. Each MDS is checked for logical and clinical coding accuracy, with recommended actions when inaccurate, incomplete, or inconsistent information is identified. Helpful alerts identify quality measure triggers and reimbursement items for compliance monitoring. DIA is integrated within the EHR’s MDS module and the feedback identifies coding errors and inconsistencies within seconds helping improve data quality across our entire database.
Additionally, at PointRight® we have adopted a DataOps framework to drive the effort of becoming more data-centric with higher investment in data quality tools as we believe that data consistency is key for better models8. DataOps is a collection of technical practices, workflows, cultural norms, and architectural patterns that enable:
- Very high data quality and very low error rates
- Clear and accurate measurement, monitoring, and transparency of results
- Collaboration across multiple teams, different technologies, and environments
- Rapid innovation, research and development facilitating the delivery of new insights to customers with increasing velocity
PointRight® has years of specialized operational and analytics expertise and the ability to effectively use current SNF resident data, which gives our customers greater visibility into the post-acute market. As the first analytics company to use post-acute data, PointRight®aligns payers and providers around value-based care initiatives, which means our customers have access to the right data and make smarter decisions.
It is important to have confidence in the quality of data fueling your health system. Instead of relying on publicly available data that may be out of date and self-reported data that may be exaggerated, working with a knowledgeable partner like PointRight® allows you to focus more on your core businesses and competencies.
Model Training, Deployment and Productization
PointRight® uses state of the art tooling across its entire data “stack” from engineering to modeling and deployment. To pull data and shape it for use by the data science team, we use Azure Data Factory to build and run our data pipelines. We have chosen to use Microsoft Azure’s Data Lake Gen2 product for data storage. For analytics and data modelling work we have chosen to use Apache Spark as our compute engine. Figure 2 illustrates an overview of our analytics framework from the collection layer to deployment as RESTful API’s.
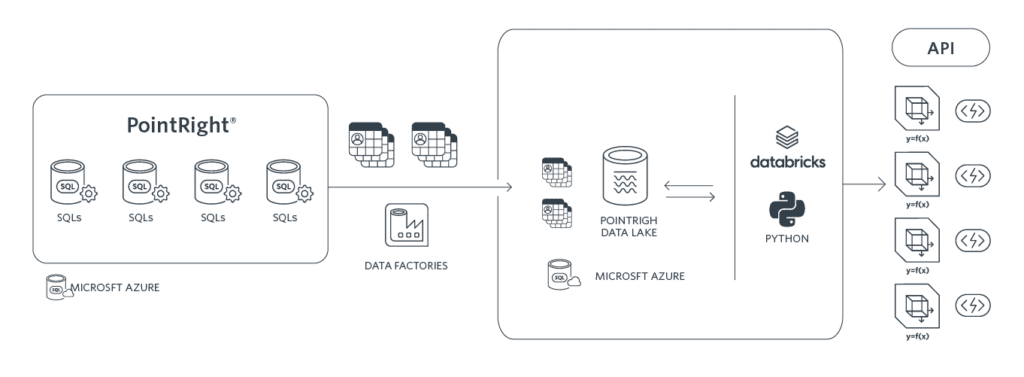
We train and test ML models using the Databricks Unified Data Analytics Platform9, a SaaS platform built over Apache Spark. Databricks delivers a unified data platform that realizes the lakehouse architecture and enables data scientists to run their data and workloads in a simple, open, and collaborative environment.
At PointRight® we use and compare multiple popular classification algorithms to predict the outcomes of interest including Logistic Regression, Support Vector Machine, K-Nearest Neighbors, Random Forest, Boosted Regression, and Forward Feeding Neural Networks.
All models are compared in terms of performance and interpretability using MLflow which is an open-source platform to manage the ML lifecycle, including experimentation, reproducibility, deployment, and a central model registry10. Through MLflow we get a better understanding of the model performance as well as the effects of hyperparameters changes to the model. The platform enables us to find the best combination of parameters to train our models on. MLflow is also very helpful as it makes it easy to track model changes over time. This is especially important when models are deployed in production for use in clinical practice and resident care.
The next step after model training is to call the model to score new data and assess resident risk. At PointRight® we use MLflow to tag all our experiments and score new data based on the multiple methodologies applied. We are thus able to order all our experiments based on key metrics and identify the best performing model for each outcome of interest. Through our integrated platform using Databricks’s model registry we can manage different model versions and production lifecycles and we are able to deploy and productize our best performing models9,10.
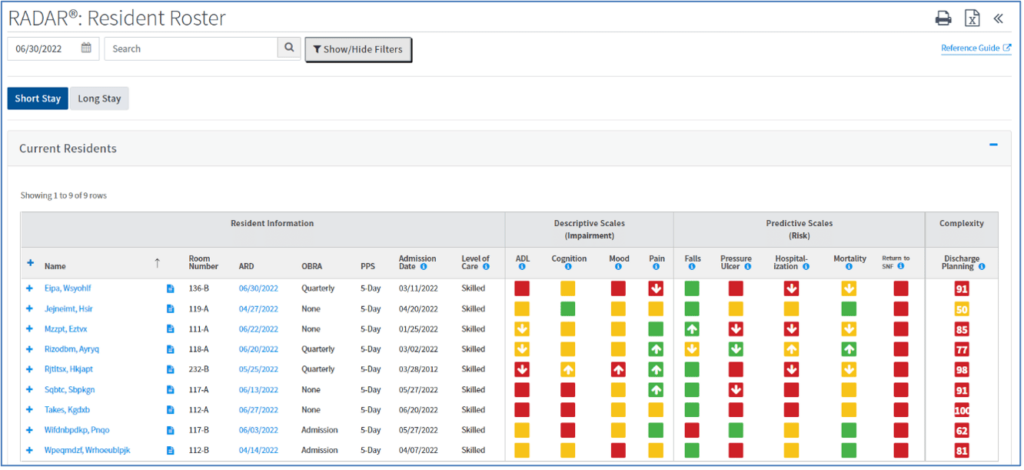
The final output of our models is a risk score for each resident and each outcome at each assessment (Figure 3).
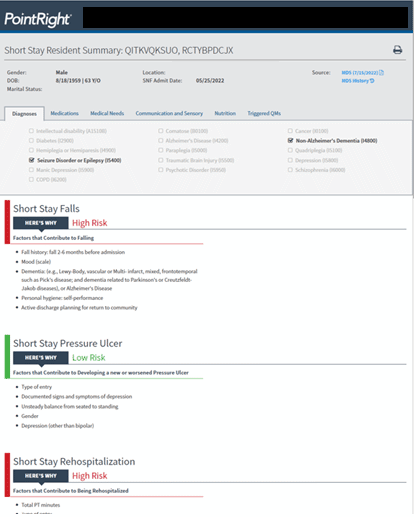
In addition to providing a risk score at the resident level, RADAR® models identify specific factors contributing to the risk for an adverse outcome (Figure 4). Adverse outcomes may be preventable through resident education and by addressing underlying issues. This is very important as by addressing modifiable risk factors through effective care planning, healthcare providers can manage risk, and adverse events can be avoided to improve resident outcomes.
From Prediction to Prevention
RADAR® includes MDS-related details for resident care planning as well as trending views of metrics over time. Our customers use RADAR® to coordinate care and prepare for safe discharge to the community for short-stay residents, and to guide care plan interventions for long-stay residents. Only RADAR® and PointRight’s® proprietary predictive analytics can provide your staff with the resident-level knowledge of who is at risk, how great that risk is, and if that risk is increasing.
Identify High-risk Residents and Care Planning Priorities
Using RADAR® you may:
- Identify residents at high risk for falls and pressure ulcers for targeted prevention programs and early intervention
- Identify residents at high risk for mortality within the next six months to facilitate end-of-life care planning discussions with residents and families to determine next steps, which may be hospice or palliative services
- Identify residents at high risk for readmission to the hospital and plan appropriate interventions to prevent ER visits and hospitalization
Improve Care Quality, Manage Total Cost of Care, and Ensure Successful Care Transitions
RADAR® displays comprehensive, actionable information within a highly intuitive user experience, that fits easily into existing user workflow.
Understanding resident risk for adverse and often, high-cost, events is critical to the planning of care management interventions. Proactive care planning at the resident level prevents adverse events, leading to better quality outcomes at the facility level.
Additionally, using RADAR® ensures successful care transitions by identifying residents at risk for returning to a SNF if discharged to the community, and by planning appropriate care and services for a successful transition. Furthermore, RADAR® identifies protective factors that support capitalizing on the resident’s strengths in the discharge care plan.
Helping Healthcare Organizations Take Advantage of Machine Learning: Two Case-Studies
For predictive models to be impactful they need to be translated into clinical practice. PointRight® has been working very closely with several customers to deploy RADAR® models in production and develop a framework and workflows to integrate analytics into their existing assessment and care planning process.
ArchCare is the Continuing Care Community of the Archdiocese of New York and one of the nation’s largest and most dynamic healthcare systems. The team at ArchCare is responsible for integrating RADAR® resident level analytics into the care planning process to ensure an individualized approach to care11.
Each Friday, residents who are at high risk for hospitalization are identified through RADAR®. An individualized plan is developed for each resident, based on their specific risk factors, to ensure that they are monitored carefully over the weekend. When a resident is identified to be at the end of life with the help of RADAR®, the team uses this information to trigger a conversation about advance care planning with the resident and their family. This supports the resident and their family in making an informed decision and choices consistent with their wishes and beliefs.
The importance of this practice became clear when the team at one of the ArchCare facilities was challenged with the care of a resident who had experienced multiple hospitalizations resulting from exacerbations of her chronic conditions. Concerned about the adverse impact of these hospitalizations on her quality of life, the team had recommended to the resident’s daughter that she consider end-of-life care planning.
Despite multiple meetings, conversations between the care team and the daughter were highly emotional and were not beneficial. The daughter continued to request a hospital transfer each time the resident had a deterioration in her condition and accused the team of just wanting to let her mother die. Explaining that they had new information to share, the care team requested yet another meeting with the daughter. She was initially skeptical, but as the team showed and explained the RADAR® information to her, she became more open to an end-of-life care conversation – eventually agreeing that comfort care measures with no further hospitalizations were in her mother’s best interest.
By framing the conversation around objective, credible analytics, the care team, and the resident’s daughter achieved alignment in the approach to her care. The resident lived in the facility another nine months, with no more hospitalizations, before passing away there.
American Senior Communities operates a portfolio of skilled nursing and assisted living facilities in Indiana and Kentucky. The care planning team utilizes PointRight® analytics in their clinical meetings to ensure the entire team is aware of resident risks identified in RADAR® 12. The team also references RADAR® analytics with respect to discharge planning. The team checks if there has been a progressive decline or improvement in their residents’ function or cognition to assess whether there is a need for modifications in clinical services or provision of additional support from other disciplines. Looking at the metrics over time to understand resident dynamics, declines and improvements can be a critical differentiator for clinical operations. Additionally, on the population level, there may be gradual changes occurring on a day-to-day basis that are not quite evident until comparing quarterly MDS-based data via RADAR®.
Conclusion
RADAR® provides a high-level overview of all current residents and identifies clinical and risk concerns while drilling down to details for risk management and care planning. It helps practitioners make confident decisions by providing data analytics that identify residents that need extra attention to address current or future problems. RADAR® can be effortlessly deployed and has immediate return on investment as high cost and problem prone areas are instantaneously identified.
Today, more than 2,500 SNFs use PointRight’s® analytics and data-driven decision support tools to reduce costs and improve outcomes, while enhancing the resident’s experience. Health systems, Accountable Care Organizations (ACOs), payers, and real estate investment trusts (REITs) have relied on PointRight® to provide insight into the health of their SNF networks and to identify areas for improvement to further their clinical, financial, and operational objectives, as well as build and manage high-performing networks.
As collaboration across settings and between providers and payers becomes increasingly vital in the world or value-based care, PointRight® will continue to develop analytics that enable all involved parties to speak a common data language and meet their operational objectives while providing the best possible care.
References
NewVantage Partners Releases 2020 Big Data and AI Executive Survey https://www.businesswire.com/news/home/20200106005280/en/NewVantage-Partners-Releases-2020-Big-Data-and-AI-Executive-Survey
Flipping the Odds of Digital Transformation Success (October 29, 2020) https://www.bcg.com/en-gr/publications/2020/increasing-odds-of-success-in-digital-transformation
Zuckerman R.B., Sheingold S.H., Orav, E.J, Ruhter J., Epstein, A.M. (2016) Readmissions, Observation, and the Hospital Readmissions Reduction Program, N Engl J Med 374:1543-1551 DOI: 10.1056/NEJMsa1513024
PointRight, A Net Health Company https://pointright.com/products/radar-care-management-tool/
What is the Team Data Science Process? https://docs.microsoft.com/en-us/azure/architecture/data-science-process/overview
Net Health® Analytics “How Predictive Analytics is Revolutionizing Healthcare – The Expanding Role of Artificial Intelligence for Clinical and Operational Decision-Making” https://go.nethealth.com/predictiveanalyticsrevolution
A Chat with Andrew on MLOps: From Model-centric to Data-centric AI https://www.youtube.com/watch?v=06-AZXmwHjo
The value of DataOps https://docs.datakitchen.io/articles/#!datakitchen-help/value-of-dataops
databricks https://databricks.com/
MLflow https://mlflow.org/
PointRight®, archcare, LeadingAge® CAST Case Study “Improving Health Outcomes, Resident Experience and Quality through Data Analytics” https://leadingage.org/sites/default/files/Improving%20Health%20Outcomes%20through%20Data%20Analytics.pdf
“Smart SNFs: Advanced Analytics in Post-Acute Care” https://skillednursingnews.com/smart-snf/