December 16, 2022 | Mark Werneke, PT, MS, Dip, MDT
3 Minute Read
Leveling the Playing Field: The Critical Role Risk Adjustment Plays in Measuring Rehab Therapy Outcomes
By Mark Werneke, PT, MS, Dip. MDT
Clinical Research Scientist at FOTO
The ability to measure patient outcomes is an essential tool rehab therapy practitioners can use to improve patient care and track clinical performance. And, as value-based care models grow in prominence, the ability to accurately measure outcomes can also affect payer reimbursement.
Yet, raw outcome data can be misleading, if not downright inaccurate, when considered without context.
That’s why as rehab therapists increasingly rely on outcome data for the benefit of their clinics, risk adjustment remains the key driver of predictive analytics to create accurate outcome comparisons between clinicians.
What is risk adjustment? Put simply, it’s the process of leveling the playing field so therapists treating more difficult patients are not penalized.
The case example below illustrates why risk-adjusted outcome data are essential to fairly and meaningfully interpret a patient’s progress and the providers’ performance compared with raw or non-risk-adjusted outcome data.
The following case is based on real-world outcomes. Risk-adjusted vs. non-risk-adjusted outcome data were analyzed by comparing outcomes between 11 different physical therapists.
The Case
Eleven experienced orthopedic physical therapists worked collectively as a research group to document functional status outcomes, using the FOTO Lumbar CAT, for patients experiencing low back pain.
Each therapist worked in a different outpatient rehabilitation clinic located throughout the U.S. And, all therapists had the same education and orthopedic credentials, similar manual skills and training, and similar years of practice.
Of this group of physical therapists, therapists No. 3 and No. 11 (see Figure 1 below) were always getting better patient outcomes at rehabilitation discharge compared with the other therapists.
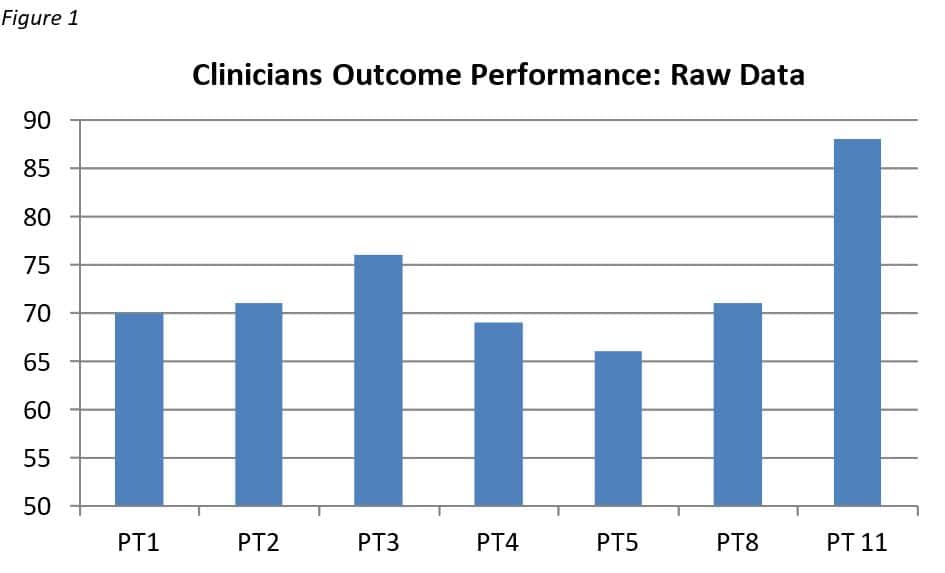
Using this outcome data, can we confidently conclude that clinicians No. 3 and No. 11 were the top performers in our research group. Do they both deserve higher recognition and perhaps higher reimbursement for their outcome performance?
It may certainly seem that way until we account for risk adjustments.
The Challenge
There are well-known patient factors not related to the clinician’s treatment which, if left unadjusted, may unfairly reward or penalize clinicians’ outcome performance.
For instance, let’s consider differences in the patient characteristics managed by clinician No. 4 and clinician No. 11 (Figure 1).
Patient’s Age
Clinician No. 11 works in a sports medicine clinic and the average patient age is 22. Consider this when compared with Clinician No. 4, who works in a nursing home with an average patient age of 75.
Symptom Duration
Clinician No. 11 treats athletes with acute sports-related injuries while clinician No. 4 treats patients with chronic musculoskeletal pain and disabilities.
Physical Ability
Clinician No. 11 treats patients with moderate functional limitations while clinician No. 4 manages patients with severe functional limitations.
It is obvious that clinician No. 11 is treating easier patients who are younger and less disabled compared with clinician No. 4. Yet, the raw data in Figure 1 does not account for these and other relevant differences and factors.
In other words, the physical therapists, in this case, are not each operating from the same level playing field, yet their patients’ outcomes – and ultimately their value – are being evaluated as if all factors were equal.
Therefore, the outcome results and performance levels using raw data displayed in Figure 1 unfairly identify clinician No. 11 as the top outcome performer and unfairly penalizes clinician No. 4.
The Solution
It is essential that patient characteristics are risk-adjusted to fairly compare outcome performance between clinicians.
When recalculating using FOTO’s predictive-analytical methods and risk adjustment on this group, for example, outcome performances between therapists No. 4 and No. 11 are interpreted quite differently.
The risk-adjusted results (Figure 2) indicate that therapist No. 11 is actually achieving lower outcomes compared with therapist No. 4.
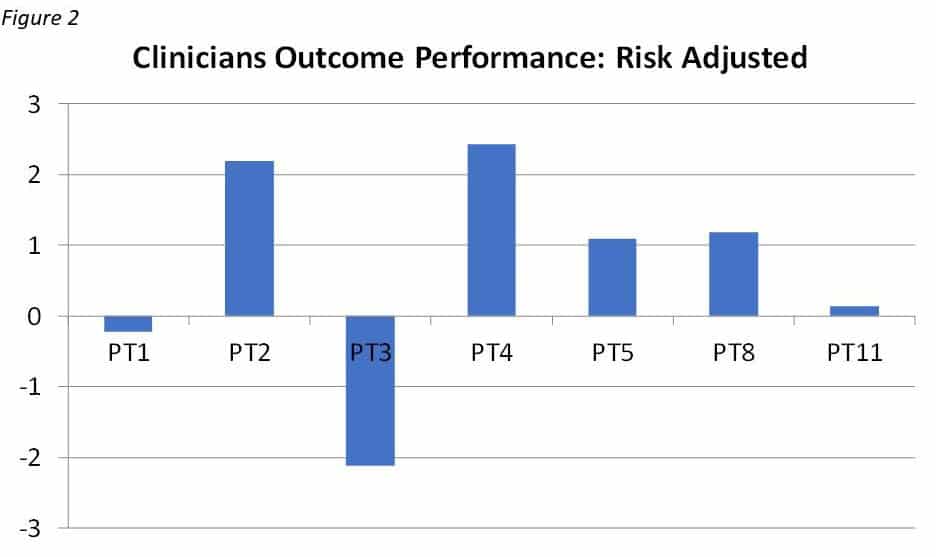
In fact, when the data is risk-adjusted, therapist No. 4 is the true top outcome performer in our research group.
As you can see from this case, risk adjustment generates fair benchmarking metrics between providers, honest marketing of services to the public, and allows for equitable reimbursement methods based on clinicians’ true performance.
In the rehab therapy market, FOTO is the state-of-the-art predictive analytical model. Using risk-adjusted data, FOTO ensures policymakers, payers, providers, and patients can accurately calculate the value of services offered by rehab therapists
To learn more about FOTO and how our data scientists achieve accurate, risk-adjusted analytics that level the rehab therapy playing field, schedule a one-on-one demo today with one of our analytics experts.
The Power of Outcomes Analytics
Did you know the power of outcomes data is at your fingertips?